
X
Research source
Want to simplify that? Let's say our hypothesis is that as consumption of chocolate increases, so does a person's self-reported happiness on a scale of 1 (unhappy) to 7 (happy). Everyone knows that eating chocolate makes you happier, right? Before we get started, identify your two variables (X and Y). Let's say we had information about how many pieces of chocolate a person eats per day (X) and what their level of happiness was (Y).

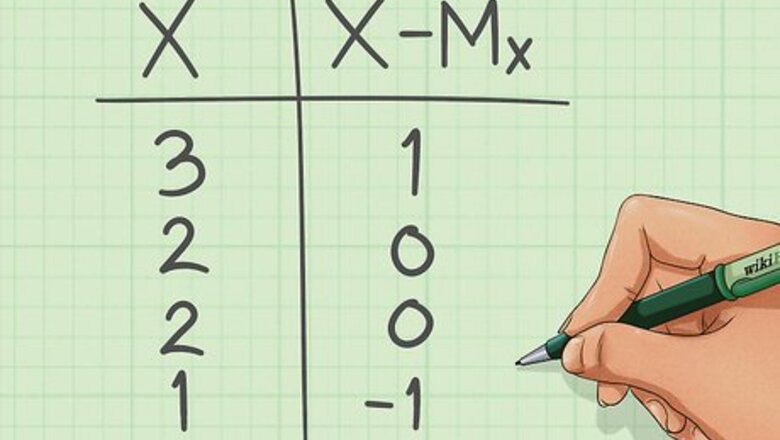
Find the average of chocolate consumption (Mx) by adding up all of the people's scores and dividing by the number of people. Then we would subtract each individual score (X) from the mean. This tells us how far away this person is from the average. You should have a new score for each person. In the formula that is: X-Mx
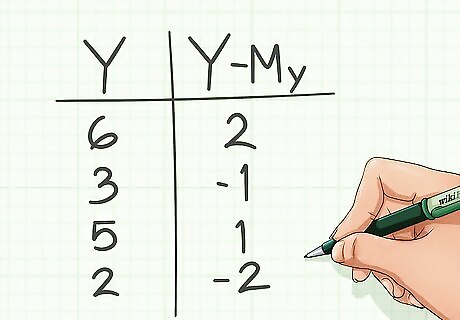
Do the same for happiness. We find the average level of happiness (My); then subtract each individual score (Y) from the mean. Again, you'll have a score for each person. In the formula that is: Y-My
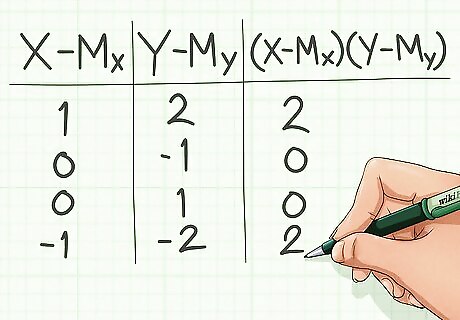
Multiply each person's deviation from the mean for their X score by their deviation from the mean for their Y score. Once again, you'll have a new score for each person. In the formula that is: (X-Mx)(Y-My)
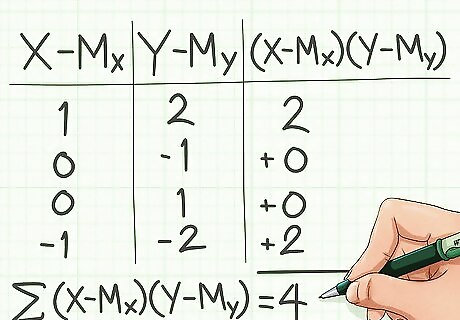
Add up all of the people's multiplied scores. That's what the funny-shaped "E" means in the formula. "Σ" is the Greek symbol for Sigma, and is used in stats to signify that you should add everything up. In the formula that is: Σ(X-Mx)(Y-My)
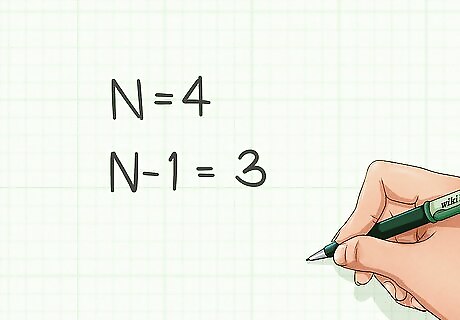
Take the number of people in the sample (N) and subtract by 1. In the formula that is: N-1
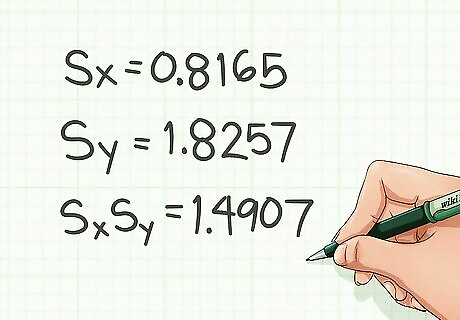
Multiply the standard deviation of chocolate consumption (Sx) by the standard deviation of happiness (Sy). If you're not sure how to calculate these values, check out How to Calculate Standard Deviation. In the formula that is: SxSy
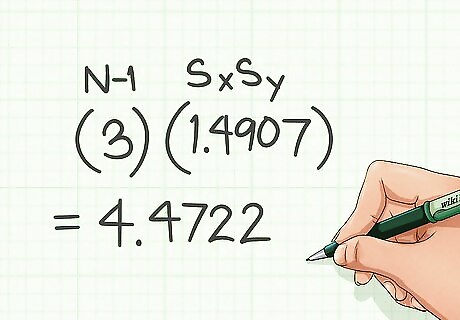
Multiply that number by the number of people in your sample minus one. In the formula that is: (N-1)SxSy
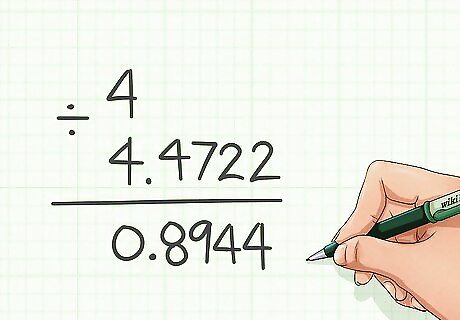
Take the number you calculated first [Σ(X-Mx)(Y-My)] and divide it by the number you just got [(N-1)SxSy].
Interpret your result. r is the symbol used to denote the Pearson Correlation Coefficient). A score of .1-.3 indicates a small relationship .31-.5 is a moderate relationship .51-.7 is a large relationship Anything above .7 is a very strong (sometimes called "isomorphic") relationship. A positive number means they move the same direction (as chocolate consumption goes up, so does a person’s happiness, and if chocolate consumption goes down, so does happiness). It doesn’t mean they both go UP—but it means they move together. A negative number means the variables move in opposite directions. That would mean that people were less happy as they ate chocolate, or people ate less chocolate when they were happy.


Comments
0 comment