views
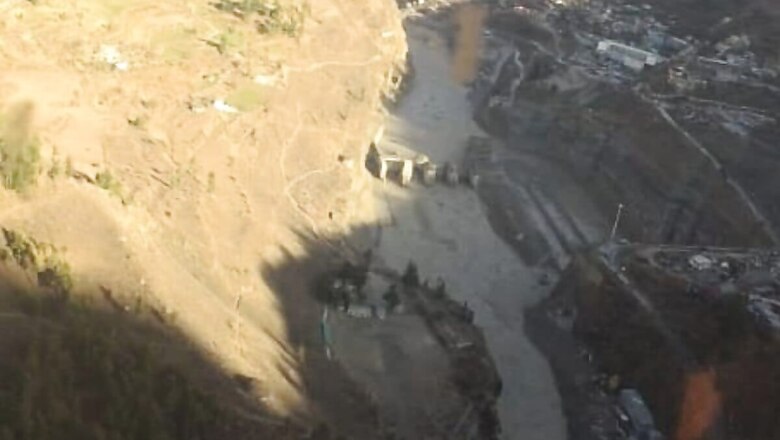
On Sunday morning of February 7, 2021, a flash flood was experienced in the Rishi Ganga valley, a tributary of Dhauliganga, in the Alaknanda basin. The flash flood led to loss in human life and caused significant damage to the Rishi Ganga and Tapovan power projects. The flash flood was surprising, considering the winter season and a clear day. However, the damage was enormous, and in this note, we are exploring the potential reasons for a flash flood. Initial reports suggest that the flash flood was caused due to breaking of the Nanda Devi glacier. The observation was widely published by numerous news media outlets and also supported by reconnaissance survey carried out by the Indian Air Force. However, subsequent investigations carried out by IIRS (Indian Institute of Remote Sensing) using satellite images, and the American Geophysical Union (AGU) landslide blog suggested that the flash flood originated from Nanda Ghunti or Trishul region.
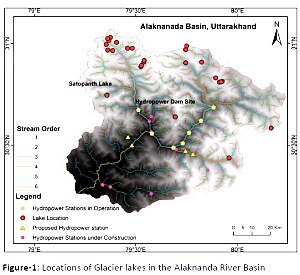
The Divecha Centre for Climate Change (IISc) and the Indian Institute of Technology, Roorkee under IMPRINT-I project investigated glacial lakes in the Alaknanda basin and 26 lakes were mapped. The paper was published in 2019 (their locations are provided in Figure-1).
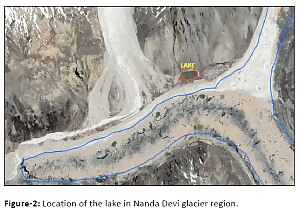
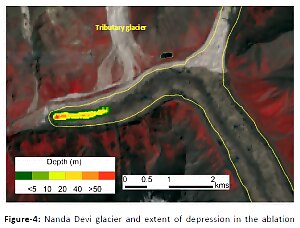
One of the lakes identified in Nanda Devi glaciers’ ablation region was 3 Ha, where the initial assessment suggests that the lake was shallow. Additionally, a substantial part of the lake might have been frozen during the winter season considering lake location and size. It may not lead to a flash flood of the magnitude experienced in the Rishi Ganga valley (see Figure-2).
The Divecha Centre for Climate Change (IISc) has developed a new tool to map depression in the bedrock below glacier ice. The tool is based on Laminar flow equation and surface slope, known as the Himalayan Glacier Thickness Mapper (HIGHTHIM). The tool was used successfully to map depressions below South Lhonak lake in Sikkim and estimate its future expansion. The tool was applied to Raunthi, Trishul, Bethartoli and North Nanda Devi glaciers. The extent and volume of depression can be gauged in Table 1.
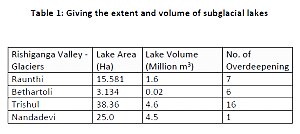
The series of depressions and sub-glacier lakes were mapped at the bottom of the Raunthi glacier. The AGU blog suggests a massive ice avalanche in the deglaciated valley of Raunthi glacier. The IIRS analysis had suggested massive avalanche and landslide in the downstream region. However, none of these analyses explains the reasons for rapid melting of avalanche snow and ice at high altitude region under winter-temperature conditions.
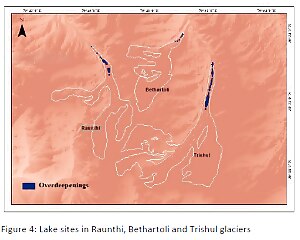
Our assessment suggests the event might have started with a massive ice avalanche, as suggested by the AGU blog. It might have led to snow avalanche/landslide downstream and a release of 1.6 million cubic metre of water stored in the sub-glacial lakes in the Raunthi glacier. It can also explain the rapid melting of snow and ice accumulated by the series of the avalanches. The region also has many glaciers with sub-glacial lakes. Therefore, further investigation is necessary to assess the risk from a flash flood.
Read all the Latest News, Breaking News and Coronavirus News here


Comments
0 comment