views
X
Research source
There are two basic methods.
Finding the Axis of Symmetry for Polynomials with a Degree of 2

Check the degree of your polynomial. The degree (or “order”) of a polynomial is simply the largest exponent value in the expression. If the degree of your polynomial is 2 (there is no exponent larger than x), you can find the axis of symmetry using this method. If the degree of the polynomial is higher than 2, use Method 2. To illustrate, take, as an example, the polynomial 2x + 3x – 1. This highest exponent present is the x, so it is a 2nd order polynomial, and you can use this first method to find the axis of symmetry.

Plug your numbers into the axis of symmetry formula. To calculate the axis of symmetry for a 2nd order polynomial in the form ax + bx +c (a parabola), use the basic formula x = -b / 2a. In the example above, a = 2 b = 3, and c = -1. Insert these values into your formula, and you will get:x = -3 / 2(2) = -3/4.

Write down the equation of the axis of symmetry. The value you calculated with your axis of symmetry formula is the x-intercept of the axis of symmetry. In the example above, the axis of symmetry is -3/4.
Finding the Axis of Symmetry Graphically

Check the degree of your polynomial. The degree (or “order”) of a polynomial is simply the largest exponent value in the expression. If the degree of your polynomial is 2 (there is no exponent larger than x), you can find the axis of symmetry using the formula method above. If the degree of the polynomial is higher than 2, use this graphical method.

Draw the x- and y- axes. Make two lines in the shape of a plus sign. The horizontal line is your x-axis; the vertical line is your y-axis.

Number your graph. Mark both axes with numbers at equal intervals. Spacing should be uniform on both axes.

Calculate y = f(x) for every x. Take your polynomial or function and calculate values of f(x) by putting all values of x into it.

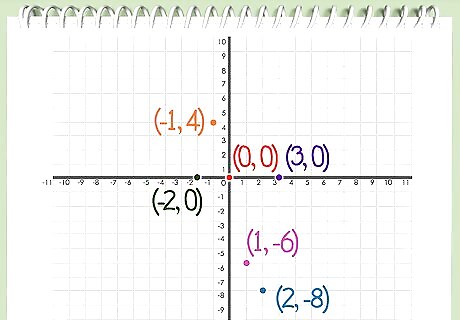
Make a graph point for each pair. You now have pairs of y = f(x) for every x on the axis. For each (x, y) pair, make a point on the graph – vertically on the x-axis and horizontally on the y-axis.

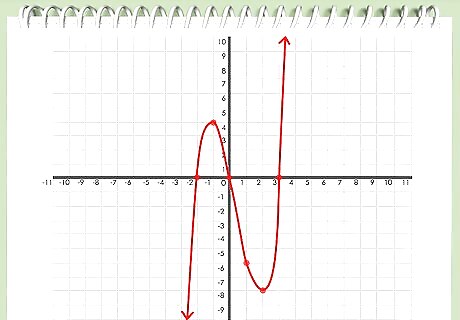
Draw the graph of the polynomial. Once you have marked all the graph points, you can connect your dots smoothly to reveal a continuous graph of your polynomial.

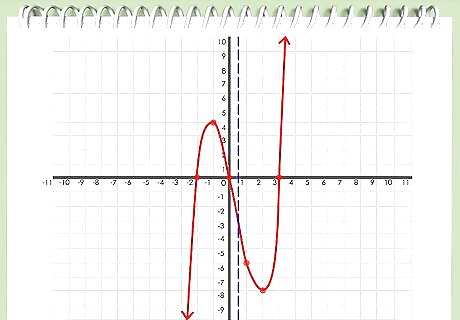
Look for the axis of symmetry. Inspect your graph carefully. Look for a point on the axis such that when a line is passed through it, the graph splits into two equal, mirrored halves.

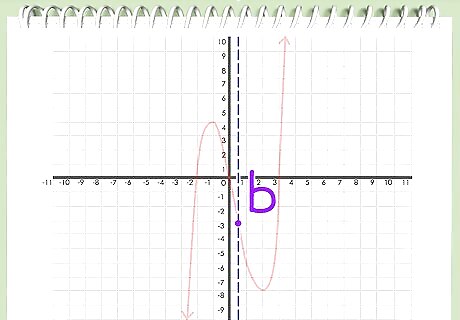
Note the axis of symmetry. If you can find a point – call it “b” – on the x-axis that splits the graph into two mirrored halves, then that point, b, is your axis of symmetry.


Comments
0 comment